Is there a botanist in the house?

I have a variety of jalapeno plants in the backyard garden. Some are thriving. Some never did very well. One plant in particular grows beautiful, gigantic, bug-resistant peppers.

I want to harvest the seeds from this plant in the hopes of propagating it next year. Here’s my science question — do all the seeds in all the peppers on this plant have the same DNA?

Spreadsheets are the devil, but here is how to avoid getting burned.

Spreadsheets seem like they are adequate tools for serious analysis. And unfortunately, people are graduating from stats and OR programs without mastering any of the other alternatives. But brother, I stand before you today to tell you that spreadsheets are the devil.

When you face a modeling problem, spreadsheets tempt you with the seemingly easy way out. It all starts with how easy it is to import data. Excel’s import wizard is fast and pretty smart about automatically assigning column types. Meanwhile, your hapless colleagues are going to spend a day reading manuals just to load in that same tab-delimited text file.

Now that you’ve got the raw inputs loaded, you figure that within a few days you’ll be done building your trendlines and you’ll kill time choosing fonts for your pie charts. But what happens — invariably — is that you think you are done and then you look at your number on your final worksheet and realize it can’t be right. You must now find the error in any of the possibly hundreds of tiny formulas all chained together. Welcome to cell HE11.

Meanwhile, while you’ve got numbers that are laughably wrong, your SAS friend after a few days at least has his PROC REPORT output to show the boss, even if he did have to print it on the basement mainframe dot-matrix printer.

So, despite all that, sometimes, I find that I just have to use a spreadsheet. In that circumstance, I try to follow a set of rules. Any time I deviate from these rules, I always get burned.

  1. Put at the top of each sheet a few paragraphs that describe the model. Ideally, this text should be so clear and specific that I can rebuild the spreadsheet just based on this information. (This also helps make sure that you implemented the logic correctly.)
  2. Indicate what are the cells that the user should play with, and what cells should not be tweaked. Point out where the final answer pops out. Establish a color scheme to distinguish between input data and formulas.
  3. Emulate the IRS 1040, where there is a column of text and just a few columns of numbers, and each row is as simple as possible. There’s a main column that gets summed at the bottom, and a secondary column where complex totals are broke down further.
  4. Decompose those formulas and don’t store literal data inside of formulas! For example, in a mortgage calculator, break out the interest rate, the mortgage size, and the number of years in the mortgage into separate cells, and then show the result in another cell:

    s1

    Don’t be tempted to cram all those numbers inside a single cell like this:

    s2

    Sure, you save a few rows and it compresses the size of your sheet, but in the end, you make your sheet much less flexible, and it will be more difficult to separate data-entry errors from formula errors.

  5. Finally, Put everything in top-to-bottom order in each sheet and have a single flow. Don’t have lots of parallel panels side-by-side. It becomes too confusing.

I am certain that there are even more rules that are better than these. Enlighten me.

Is TurboGears dying?

Popularity is not the best indicator of quality, but I don’t like this chart one bit:


Photos from the 2007 potato harvest

When I talked to her this spring, my grandmother told me to be sure to plant some potatoes. I’m glad I did. I bought a bag full of tiny starter potatoes in April, and a few weeks later, I planted them.

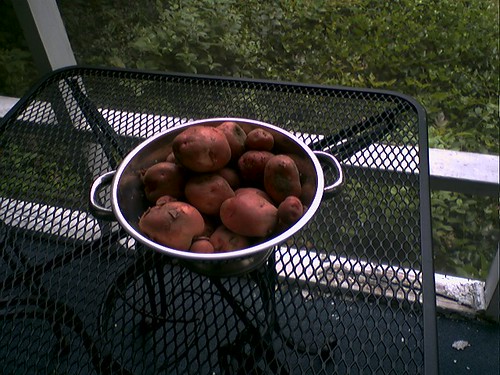
My 1962 Time Life Encyclopedia of Gardening recommends digging up half the crop early to enjoy “new” potatoes. I took these shots around the beginning of August when we harvested about half the plants. Here’s our haul:

0714071837

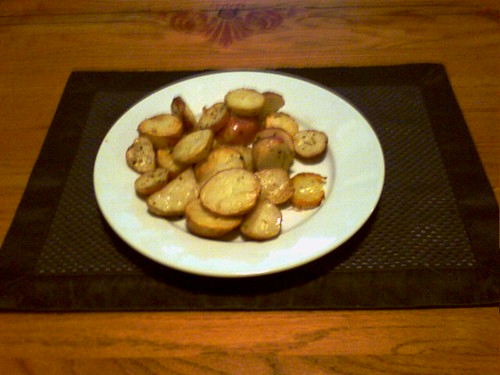
After digging them all up, and washing them thoroughly, we sliced them up and then roasted them with olive oil, rosemary, and lots of salt and pepper. Here’s a shot of the finished product:

0714071948a

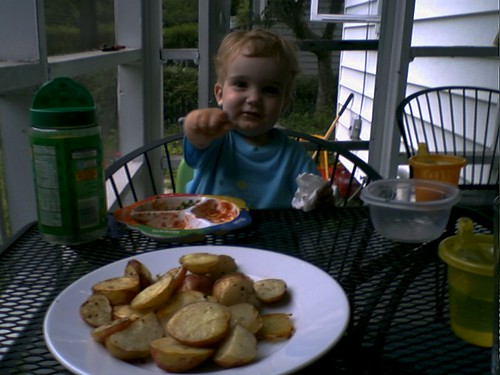
Finally, I took this picture while Charlie and I ate dinner on the back porch:

0714071949a

It is a cliche to claim that backyard vegetables somehow taste better, but these potatoes really seemed different. I could rub the red peel off with my fingers. I swear these remained moist even after roasting them. Within a few hours of digging up these plants, we were eating them. Anything at Giant Eagle is at least 3 or 4 days old, maybe more.

We dug up the rest of the potatoes at the beginning of October. I didn’t take any pictures and this time my wife mashed them up with lots of chives (from the garden) and sour cream (from the grocery store).

I’ll definitely plant red potatoes again next year. The yield was fantastic, and the rabbits and squirrels seemed to ignore them.

Next year, I’ll experiment with a no-dig method I read about where the potatoes get buried in mulch, and over the season, more mulch gets added repeatedly to encourage more growth. I dumped more mulch over my plants this year after I got a tip from a colleague, and that seemed to encourage more tubers to form.

In summary, potatoes are neat.

I submitted a topic for CodeMash 2008

I attended last year’s CodeMash conference and learned a lot. This year, I submitted a topic. Here’s my description:

Bottom-up programming with IPython

IPython is a vastly improved Python interactive interpreter.

You can start up the interpreter, load in a module, execute a function from that module, then hop from your interpreter into your favorite editor to redefine that function, then go back to the interpeter and run the automatically reloaded function.

If your new code raises an uncaught exception, you can start a python-debugger session right there and inspect the traceback.

With all these tools integrated, you can attack problems by building separate components and then put them together in the interpreter and watch what happens. If you find a bug, you have immediate access to the traceback, so you don’t need to go back into your code and logging or print statements.

Fans of iterative development and using introspection will likely enjoy this talk.

We’ll see what happens.

Thoughts on TechLift Cleveland

TechLift is a non-profit organization that helps out tech firms in Ohio. I went to an overview tonight.

This was the first time I’ve been around a bunch of venture capitalists. The first thing I realized when I got there was that I wasn’t wearing a suit, but everyone else was. I thought nobody wore suits anymore. Now I realize that everybody above a certain level of wealth still wears suits. And the people that want those people’s money still wear suits.

Anyhow, TechLift is interesting — one speaker described its purpose as getting firms ready to collect venture capital. TechLift takes in hundreds of applications, thins the pool down to a few dozen, invites them in for presentations, then picks about five firms and coaches them through the startup process. TechLift prefers to select companies that are already well-developed rather than ones with interesting ideas but incoherent business plans. In the business life cycle of imagining -> incubating -> demonstrating, TechLift focus on firms in the incubation stage.

Meanwhile, to reach out to those companies at the beginning, TechLift started the Idea Crossing site this year. That site is sort of like investment banking meets web 2.0. Startups describe themselves, and the site connects them to relevant mentors, investors, and service providers.

One speaker made a remark that I thought was clever:

It’s easy to forget that the goal was draining the swamp when you’re fighting the alligators.

Lua metatable examples

Lua has exactly one data structure — tables. And it uses those to implement everything else.

This is how inheritance works in lua:

t1 = {a = 3} -- t1 is a table with one name-value pair.
t2 = {} -- t2 is an empty table.
setmetatable(t1, t2) -- t2 is t1's metatable.
t3 = {c = 5} -- t3 is just another table like t1.

t2.__index = t3 -- when a lookup fails in t1, t2 will look for a value
-- in t3.

print(t1.a)
print(t1.b)
print(t1.c)

And the output is here:
$ lua lua_fun.lua
3
nil
5

This page explains with more detail.

When I first read this stuff, I wondered why I I couldn’t just make the metatable t2 be the place where t1 goes when a lookup fails, rather than require t3 to hold the defaults. Then I realized that __index doesn’t necessarilly need to point to another table. It could also hold a function, like this:

-- Now, we'll change the way t2 handles failed lookups in t1 so that it always returns the key that was asked for.
t2.__index = function (t, k)
return k
end

print(t1.a)
print(t1.b)
print(t1.c)

And now we get:
3
b
c

It is actually possible to make t2 be the metatable:
-- What happens with this?
t2.__index = t2
t2.d = 6

print(t1.a)
print(t1.b)
print(t1.c)
print(t1.d)

The results:
3
nil
nil
6

In conclusion, lua is neat.